
The rise of Low-Code platforms has revolutionized software development. The delivery of applications has become faster, but visibility into internal flows and application execution requires even more attention. How can we ensure the stability, performance and reliability of these applications, especially when they integrate with complex architectures based on microservices?
In distributed and fast-paced development environments, it is essential to understand how the application behaves, identify where bottlenecks arise, and find out why certain errors only appear in production. To achieve this, it is important to apply a clear view of what happened, where the problem occurs, and why it manifests. This approach not only helps stabilize the system but also ensures that support teams can perform troubleshooting efficiently, facilitating the continuous maintenance of the application and guiding the planning of upcoming versions.
Do You Really Know What Happens to Your Request?
In a microservices architecture, a single user action can trigger a chain of events that passes through dozens of different services, databases, and external APIs. If that request is slow or fails, the error may be in any one of those points.
In platforms like OutSystems, in the ODC portal, you already have access to error logs, execution audit, and traces to track action and API calls. This covers common troubleshooting scenarios very well, especially during development or quality validation.
For critical corporate environments or those that require higher levels of observability, ODC provides a solid monitoring foundation that can be enhanced with specialized integrations. These integrations do not replace ODC, but expand its capabilities, allowing it to support more complex architectures:
- Distributed Tracing: Although ODC provides internal visibility into application behavior, tracing integrations allow you to go further by offering a complete view of a request’s journey across multiple services, APIs, and external microservices. Thus, in distributed architectures, these tools complement ODC by revealing points of slowness or failures outside its direct environment.
- Advanced log and metric analysis: ODC already provides essential logs and metrics for daily monitoring, but additional integrations make it possible to elevate this level of analysis with features such as event correlation, advanced queries, real-time dashboards, and customized alerts. In this way, ODC remains the operational foundation, while the connected tools expand investigative depth when needed.
If you are running critical applications with high transaction volume, external integrations, and tight SLAs, observability needs to be: Centralized, Correlated, Customizable, and Proactive. ODC facilitates the use of Trace/Log Analytics by adopting them natively and allowing export through OpenTelemetry, but the responsibility for propagating the Trace ID in complex integrations still requires deliberate configuration by the Low-Code developer.
In this scenario, Trace + Log Analytics through integration with external tools perfectly complement what ODC offers, elevating monitoring to the level of observability.
Observability in Practice: Distributed Tracing
When a Low-Code flow calls an external service, and that service calls another, and so on, tracking latency becomes more difficult when using traditional or native monitoring methods. Distributed Tracing solves this problem by assigning a unique identifier, the Trace ID, to each request at the moment it enters the system.
- Instrumentation: Each service or Low-Code component must be instrumented to generate and propagate a Trace ID, ensuring that the entire journey of the request can be tracked end to end.
- Spans (Operations): Within this Trace ID, spans are created to represent specific operations, such as API calls, database queries, or the execution of business rules in Low-Code.
- Visualization: Observability tools collect these spans and display them in a format similar to a Gantt Chart*, allowing you to visualize the request timeline, identify the duration of each operation, and detect where the highest latency occurs.
*Distributed Tracing organizes these spans in sequence and hierarchy, allowing the Gantt Chart to transform raw latency data into a clear and intuitive visual map of the system’s execution.
To instrument a Low-Code environment, the ideal solution involves using API gateways that automatically inject a Trace ID into the request header before it reaches the Low-Code component. There are tools on the market capable of supporting this solution, such as Kong, essentially open source, or Apigee, for a more robust, complete, and scalable platform.
Log Analytics: From Text File to Operational Intelligence
If Trace shows the path and timing of the request, Logs show what happened during execution. However, logs scattered across different servers or stored as text files can make real-time diagnostics difficult.
Log Analytics is the process of collecting, centralizing, normalizing, and analyzing large volumes of log data generated by all components of your system. It transforms unstructured information into structured and searchable data.
With Log Analytics, you transform raw data into visual performance indicators, real-time alerts, anomalous pattern detection, and even failure diagnosis before it impacts the user.
For Log Analytics to be effective, your logs must be structured, preferably in JSON format.
- Unstructured Logs:
- [2025-11-24 12:00:00] ERROR: Failed to process invoice for customer 123
- Structured Logs:
{
"timestamp": "2025-11-24T15:00:00Z",
"level": "ERROR",
"message": "Failed to process invoice",
"customer_id": "123",
"application": "ERP-LowCode",
"flow_step": "GenerateInvoice"
}
This becomes possible in ODC through integrations with several platforms that allow you to collect, correlate, and visualize data in an advanced way, expanding the observability capabilities of the low-code environment without losing the platform’s native simplicity.
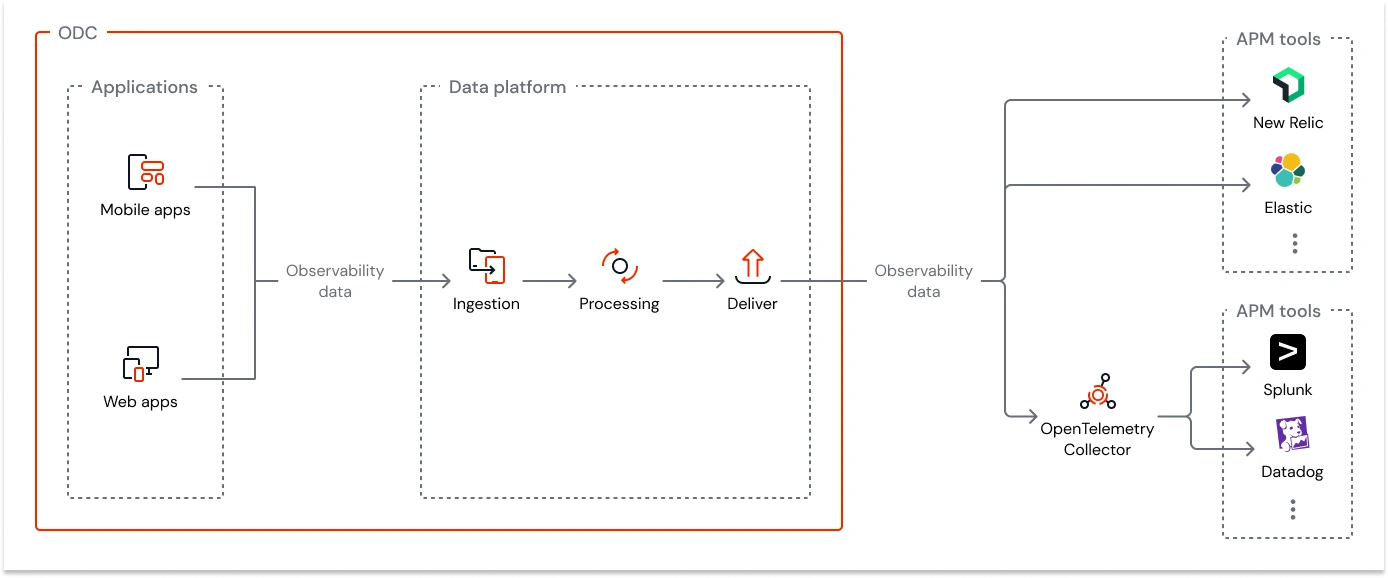
To learn more, visit: Streaming observability data - ODC Documentation
The Key Point of Observability
True intelligence happens when you correlate Logs and Traces.
ID Injection: The most vital step is ensuring that the Log ID (or the Trace ID itself) is injected into every log line generated by that specific flow.
Integrated Query: When the Trace ID shows that a span took 5 seconds, you click on it and the Log Analytics platform automatically filters and displays all logs associated with that specific Trace ID and Span ID.
This eliminates the need to manually sift through gigabytes of logs to find the root cause, revealing the line of code or Low-Code business rule that failed.
Step | Action | Tool (Examples) | Main Benefit |
1. Collection | Centralize all Logs and Spans in a single location. | Fluentd/Logstash (for logs), OpenTelemetry Collector (for traces), APM agents. | Unified Data Source. |
2. Standardization | Define a Structured Log (JSON) standard with required fields: trace_id, timestamp, level, message. | Business Rules in the Low-Code Platform. | Efficient Search and Correlation. |
3. Instrumentation | Configure APIs and Low-Code wrappers to propagate the trace_id. | Distributed Tracing SDKs (e.g., Jaeger, Tempo) or native APM solutions. | Complete mapping of the request flow. |
4. Anslysis | Use tools that allow advanced queries and visualizations (Kibana, Grafana Loki/Tempo, Datadog, New Relic). | Observability Platforms. | Transform data into actionable insights. |
The adoption of Trace and Log Analytics is not a luxury, it is an operational necessity
Low-code platforms offer an undeniable competitive advantage. However, their long-term effectiveness depends on your team’s ability to maintain the health and performance of the applications.
By integrating these pillars of Observability into your Low-Code ecosystem, you move your operation from a reactive state (putting out fires) to a proactive and predictive one. You ensure that the speed of Low-Code development is not compromised by a lack of visibility, building not only fast applications but also robust and reliable systems capable of sustaining your business’s growth.
Observability in Action: The Strategic Plan in Practice
Transforming Observability into a reality requires a structured action plan, especially on Low-Code platforms. At YasNiTech, our experience demonstrates that the key is the standardization and centralization of telemetry data.
Reusable and Integrated Log Structure
Aiming to create a log structure that was not just a text file, but a rich source of data for analysis, Yasnitech focused on creating a generic framework within the Low-Code platform to centralize information collection:
- Standardized Log: We developed an internal library that encapsulates all logging logic, ensuring that every log follows a single structure (LogEntry).
- Essential Data: This structure ensures the automatic inclusion of crucial information for troubleshooting, such as UserId (to track the user) and, most importantly, the CorrelationGUID (our correlation index for Trace).
- Ease of Use: We created wrappers (simplified actions) specific for Action Logs and Error Logs, allowing the Low-Code developer to record information easily and standardized, without worrying about the underlying JSON complexity.
- Practical Action: When using the native LogMessage action, we transform the log structure into a JSON and insert it into the message. This transforms the log into structured data, ready to be ingested by any Log Analytics tool.
About YasNiTech
Founded in 2013 by former IBM professionals, YasNiTech is a global technology company with offices in São Paulo, Boston (USA), and Sansepolcro (Italy). Since its inception, it has quickly established itself in the Brazilian market by delivering innovative solutions in fraud detection, loss prevention, and business analytics.
Over the years, the company has expanded its portfolio, incorporating initiatives in Low-Code platforms, digitization, and process automation. Among its innovations, it introduced the first Multi-Enterprise Business Process Digitalization tool to the Brazilian market, boosting digital collaboration within the supply chain.
In its current phase, YasNiTech positions itself at the forefront of Artificial Intelligence, with a special focus on Agentic AI. The company develops intelligent and autonomous solutions that enhance decision-making, operational efficiency, and innovation across multiple sectors of the economy, such as healthcare, pharmaceuticals, logistics, and industry.